The Institute of Cetacean Research


Completion of Japanese Abundance and Stock-structure Surveys in the Antarctic (JASS-A) 2024/2025 Research Cruise
March 14, 2025
Designated Corporation for Scientific Whale Research
THE INSTITUTE OF CETACEAN RESEARCH
1. Background
This research program is a continuation of the Japanese government's research program (non-lethal research) aimed at the sustainable use of whale resources in the Antarctic Ocean, and this survey is the sixth research cruise in the Antarctic after Japan's withdrawal from the International Whaling Commission (IWC) on June 30, 2019. This year's research in the Antarctic included a sighting survey, biopsy sampling, satellite tagging, oceanographic observation and collection of other relevant information on cetaceans.
The scientific information obtained from this research will be provided to relevant international organizations such as the IWC Scientific Committee, the Ecosystem Monitoring and Management Working Group of the Commission for the Conservation of Atlantic Marine Living Resources (CCAMLR) and the Scientific Committee of the North Atlantic Marine Mammal Commission (NAMMCO) to contribute to the appropriate management of whale resources in the Antarctic Ocean.
The research vessels Yushin-Maru No. 3 and Yushin-Maru No. 2 departed from Shiogama, Miyagi Prefecture on December 6, 2024, and returned to port on March 14, 2025, after conducting research for 41 days (from January 1 to February 10) in the south of 60 degrees south latitude.
2. Survey Plan
This survey is financially supported by the Fisheries Agency, and the Institute of Cetacean Research takes the lead in planning, implementing and conducting analyses of data obtained from it.
2.1 Main Research Objectives
The main research objectives of JASS-A are:
(1) Study of abundance and their trends of large whale species in the Antarctic Ocean.
(2) Study of the distribution, movement and stock structure of large whale species in the Antarctic Ocean.
2.2 Research Area
This year's survey area was the eastern part of Area IV, one of the IWC management areas in the Antarctic Ocean, south of 60 degrees south latitude and between 100 and 130 degrees east longitude (Figure 1). In addition, mid- and low-latitudinal sighting surveys were conducted during the cruise to and from the research area.
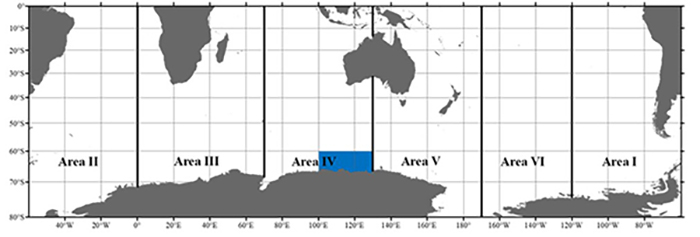
Figure 1. The 2024/2025 JASS-A Research Cruise area is shown in blue.
2.3 Research Cruise and Survey Period
Research cruise: 99 days (December 6, 2024 - March 14, 2025, Shiogama Port depart and return).
Number of survey days (south of 60 degrees south latitude): From January 1 to February 10, 2025 (41 days).
2.4 Research Vessels and Researchers
Thirty-six people, including Chief Scientist Katsumata, Captain Abe, and Captain Kasai, were onboard and engaged in the research cruise.
Yushin-Maru No. 3, (743 tons, Captain Hidenori Kasai, Kyodo Senpaku, Ltd.), 18 crews in total, including Taiki Katsumata, Chief Scientist, and another researcher both from the Institute of Cetacean Research,
Yushin-Maru No. 2, (747 tons, Captain Nobuo Abe, Kyodo Senpaku, Ltd.), 18 crews in total including Minato Kawasaki, Research Scientist, and another researcher both from the Institute of Cetacean Research.
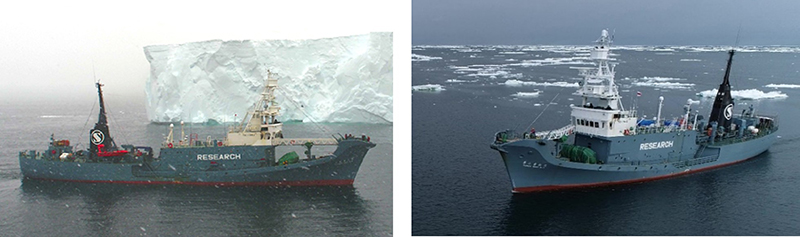
Figure 2. The JASS-A research vessels, Yushin-Maru No. 3 (left) and Yushin-Maru No. 2 (right).
2.5 Implementing Body
Designated Corporation for Scientific Whale Research ? The Institute of Cetacean Research.
3. Survey Results Summary
3.1 Sighting Survey
Total search distance south of 60 degrees south latitude: 2,492 nautical miles (about 4,614 km).
Main whale sightings within the research area:
Humpback whale: 850 schools; 1,514 animals (Figure 3)
Antarctic minke whale: 148 schools; 322 animals (Figure 3)
Fin whale: 28 schools; 72 animals
Blue whale: 19 schools; 25 animals
Southern right whale: 3 schools; 3 animals
Dwarf minke whale: 1 school; 1 animal
Sperm whale: 3 schools; 3 animals
Southern bottlenose whale: 12 schools; 22 animals
Killer whale: 9 schools; 234 animals
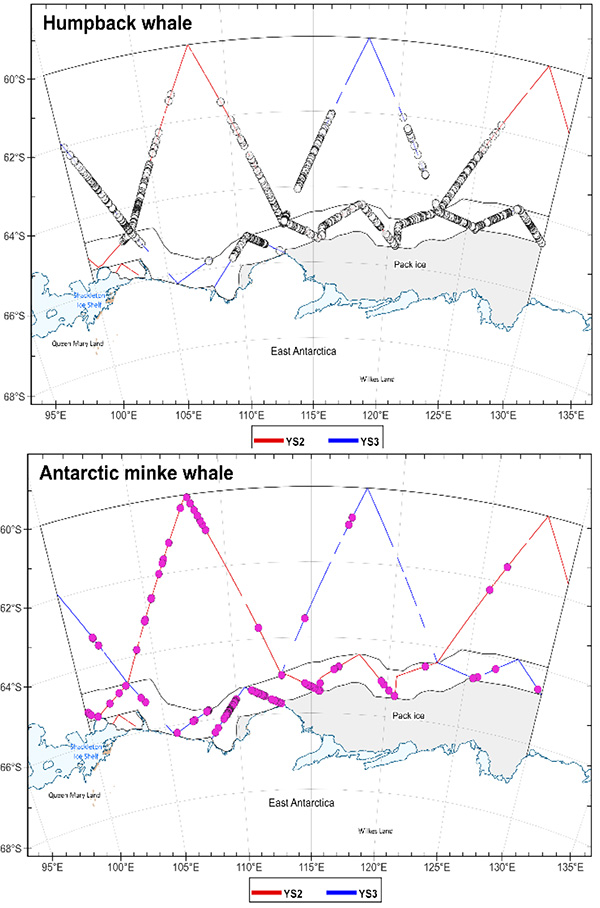
Figure 3. Locations of humpback whales (top) and Antarctic minke whales (bottom) sighted in the research area.
3.2 Oceanographic Observation by XCTD (Expendable Conductivity-Temperature-Depth probe)
Observations were conducted at 163 stations within the research area south of 60 degrees south latitude.
Water temperature and salinity were measured from 0 m to 1,850 m depth for the purpose of comparing ocean structure and cetacean distribution. The environmental index MTEM200 (mean water temperature from the surface to a depth of 200 m) was calculated from the observed data to provide a rough idea of the distribution of water masses within the research area (Figure 4).
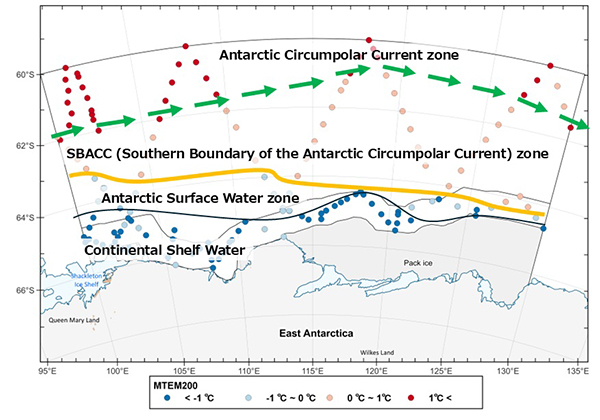
Figure 4. Schematic diagram of water mass distribution based on XCTD observation stations and MTEM200.
3.3 Satellite Tag attachment experiment
Satellite tags were attached to 11 fin whales, 25 Antarctic minke whales and 2 humpback whales.
Data on their migration and diving behavior was collected (Figure 5).
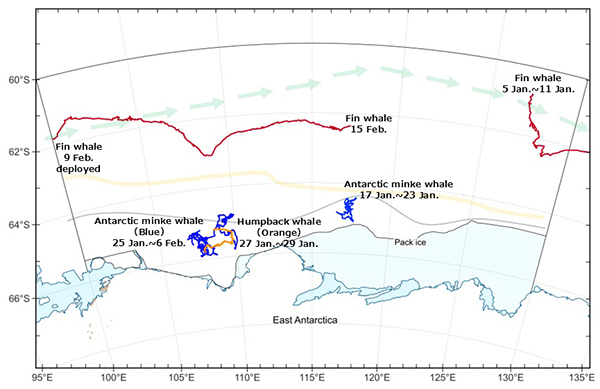
Figure 5. Schematic diagram of migration tracks and water mass distribution by whale species based on satellite tag tracking. Red: fin whale; blue: Antarctic minke whale; orange: humpback whale.
4 Key Findings from the Survey Results
4.1 Increasing trend of humpback whales
● Among large cetaceans, only humpback whales showed a significant increase in density index.
● The humpback abundance may have increased beyond the initial resource level.
Interpretation
A comparison of the density index (DI: number of schools found per 100 nautical miles) of large cetaceans in past surveys conducted by the Institute of Cetacean Research and the current survey indicates that only humpback whales showed a significant increase. Some overseas research reports indicate that the abundance of humpback whales visiting this area has recovered to 94% of the initial (before the past commercial whaling) resource level as of 2015, suggesting that the humpback whale abundance may continue to increase beyond their initial resource level. To accurately understand this trend of the abundance, it is necessary to conduct a detailed analysis in conjunction with the results of surveys in adjacent waters to be carried out in the next fiscal year and beyond.
4.2 Large whale species distribution
● Distribution trends differed among humpback, Antarctic minke and fin whales.
● The distribution of each whale species is thought to reflect their prey species distribution.
● It has been pointed out that changes in the marine environment may be altering the distribution patterns of prey species, which may also affect the distribution of cetaceans.
Interpretation
Analysis of oceanographic observations by the research vessels, location of detection, and tracking data by satellite tags revealed that humpback whales avoided the Circumpolar Current and were mainly concentrated in the area south of 62 degrees south latitude, from the southern boundary of the Antarctic Circumpolar Current to the ice edge (Figures 3 and 4). On the other hand, Antarctic minke whales were found mostly in low-temperature areas (ice shelf cold waters) south of 65 degrees south latitude (Figures 3 and 4). Individuals tracked by satellite tagging also tended to remain in low-temperature waters with MTEM200 below -1oC (Figure 5), indicating that this species prefers low-water temperature environments. Fin whales observed after satellite tag attachment moved significantly eastward along the Antarctic Circumpolar current, exhibiting a very different behavior from the Antarctic minke whales which stayed within a narrow range (Figure 5).
Since the Antarctic Ocean serves as a feeding ground for cetaceans, the distribution of each whale species is thought to be influenced by the distribution of prey species. Seawater temperatures have also been reported to have increased in recent years in this research area. Among the prey species used by cetaceans, krill species such as Thysanoessa macrura prefer relatively high-water temperatures, and it has been reported that their distribution area tends to expand as sea water temperatures rise. On the other hand, Antarctic krill and ice krill (crystal krill) are Antarctic minke whale prey species, which prefer relatively low water temperatures, and are thought to be distributed on the Antarctic continental side, where there is a low water temperature zone. Cetacean distribution is thought to reflect the distribution of these prey species.
We expect that the relationship between the distribution of cetaceans and their prey will be further clarified by identifying the prey species of cetaceans from the analysis of biopsy samples collected in the current research and comparing them with the distribution of large cetaceans and the oceanic environment structure.
 |
 |
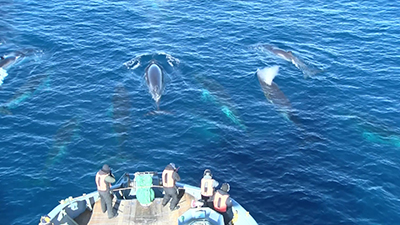 |
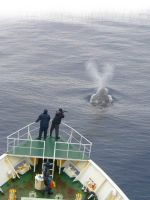
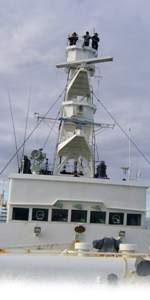
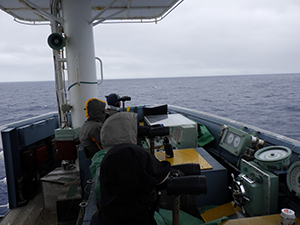
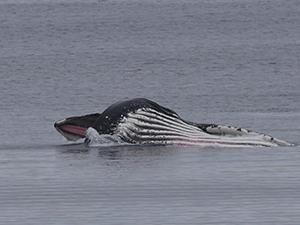
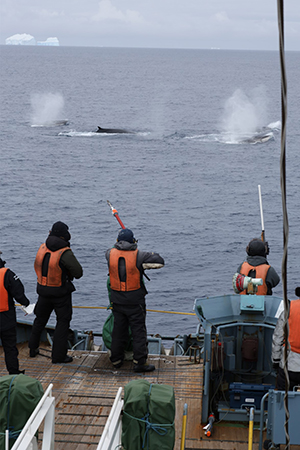
| Researchers and observers during sighting survey | Humpback whale feeding behavior | Satellite tagging on a large Antarctic minke whale school |
 |
 |
|
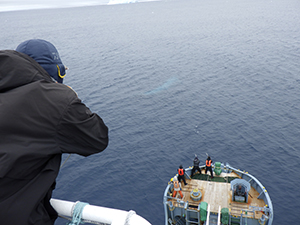
| Biopsy sampling experiment | Fin whale satellite tagging |
Completion of Japanese Abundance and Stock-structure Surveys in the Antarctic (JASS-A) 2024/2025 Research Cruise (PDF file)